

Input and Organize Survey Data on Microsoft Excel with the TechnoSales Curriculum
In the realm of data management, the seemingly mundane task of organizing survey data in Excel holds immense potential to unlock a wealth of valuable insights. This article delves into the significance of data structuring and its impact on extracting meaningful information from surveys. As we embark on this journey of data mastery, we’ll incorporate practical lessons from the TechnoSales curriculum. These lessons will serve as a comprehensive guide for students, teaching them the fundamental techniques of survey data entry in Microsoft Excel, effective data formatting, and essential formula applications.
Importance of Organizing Survey Data in Excel:
Ease of Analysis:
Well-organized data facilitates easier analysis, allowing you to draw meaningful insights and trends. Data Integrity: Proper organization reduces the risk of errors, ensuring data integrity. It minimizes the chances of misinterpretation or mistakes during analysis.
Efficient Reporting:
A well-organized dataset streamlines the process of generating reports. It saves time and effort in creating visualizations or summaries.
Facilitates Collaboration:
If multiple people are working with the data, an organized structure makes it easier for them to understand and collaborate on the project.
Long-Term Usability:
Organized data is more likely to remain usable over the long term. Revisiting and working with data is easier when it’s structured clearly and consistently.
Compliance and Auditing:
For projects that require compliance or may undergo auditing, an organized dataset is essential for transparency and accuracy.
TechnoSales Curriculum Activity
Now that we have seen how important it is to organize data in Microsoft Excel, elementary-grade students can systematically learn these skills under the TechnoSales curriculum by TechnoKids. In TechnoSales, students plan a bake sale to raise money. This task requires them to investigate food preferences and analyze financial data to make decisions about the fundraiser. Findings are organized into a report with graphs to show why their decisions will make the bake sale successful.
The following session plan is covered:
- Introduction to Microsoft Excel
- Conducting survey and organizing data on Microsoft Excel
- Analyze survey results.
- Representing data in Pie Graph format
- Preparing a report using Microsoft Word
Through this Blog, you will learn the correct step-by-step procedure to enter survey data and organize Dessert Survey Results
Open Excel and Click and Blank Workbook.
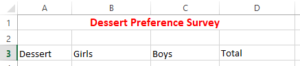
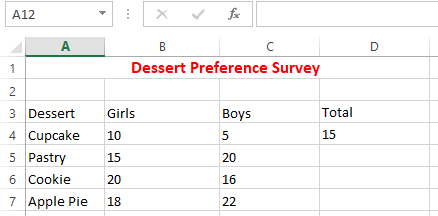
Add the Title ‘Dessert Preference Survey’ and make it look good as a part of the TechnoSales Curriculum lesson plan.
- In Cell A1 type Dessert Preference Survey

- Merge and Centre the title – Click & drag to select the cells – A1, B1, C1, and D1
- Under the Home Tab pane, go to the ‘alignment’ section and ‘merge and center.
![]()
To format the text
- Select the title Dessert Preference Survey
- Use different options from the Home Tab to experiment with other commands like font style, font size, bold, italics, underline, and color.
![]()
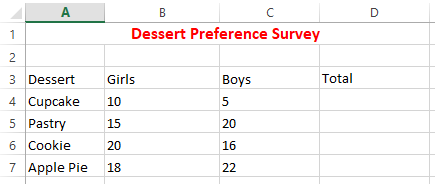
Record the survey information.
- Write column headings as under by moving from cells A1 to D1 by pressing the Right -> arrow key.
- Enter the names of desserts under the Dessert Heading in A4 and continue until all the desserts mentioned in the survey are populated.

- Input the counts by indicating how many girls and boys favored each dessert. Press the enter key to proceed to the next cell.
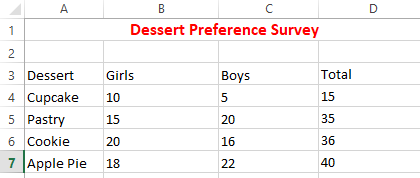
Calculate the Total Using the AutoSum Formula
- Go to Cell D4, select the AutoSum button from the Home Tab, and press enter.
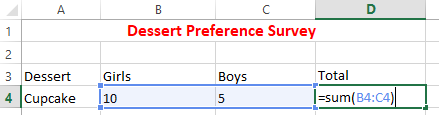
- Drag the AutoFill Cell down from D4 to calculate the total of other dessert items + and draw inference on the survey under the TechnoSales curriculum.
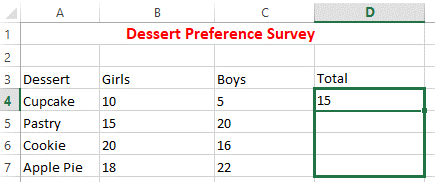
If you glimpse through the Formula Bar you will get to see the formulas as;
=SUM (B4:C4)
=SUM (B5:C5)
=SUM (B6:C6)
=SUM (B7:C7)
Rename the Worksheet
- Choose “Sheet 1,” located at the bottom of the Excel worksheet, then click the right arrow key. Select the “Rename” option and input “Dessert Survey” as the sheet title.
![]()
In summary, the TechnoSales curriculum, illustrated by a bake sale scenario, seamlessly guides elementary students in surveys, analysis, and reporting, nurturing robust data literacy and survey organization skills. This integration harmoniously combines Excel’s power with education, fostering insightful decision-making.