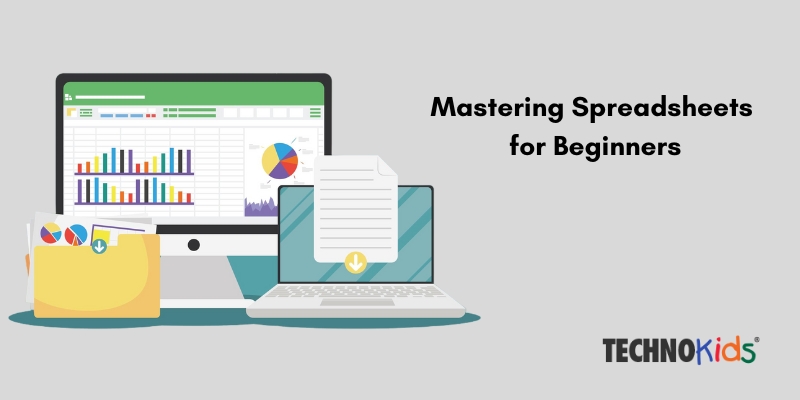
Microsoft Excel is a powerful tool for data organization, analysis, and visualization. Did you know that every Excel Worksheet that we use today has around 1,048,576 rows and 16,384 columns? Its versatile formatting features allow users to present data in a clear and visually appealing manner. In this blog, we will explore Excel lessons for beginners and some of the key formatting features of Excel.
Important Formatting Features in Microsoft Excel:
- Cell Formatting: Extensive customization is possible in Excel to improve the overall appearance of presenting data systematically. As a student, you can experience various font styles, colors, and sizes or underline important data, as per your requirements. Even the thickness of cell borders can be adjusted in the tabular data format. Excel lessons for beginners are always fun and engaging.
- Number Formatting: Numbers in Excel can be formatted in various ways to reflect their purposes, such as currency (e.g.€,¥), percentages, dates (e.g. 03-Jul-2024), or fractions. This feature gives a meaningful context to the data which is represented on the sheet.
- Conditional Formatting: Add a professional-level layout to the Excel sheet by opting for Conditional Formatting. This method allows students to automatically apply formatting (like font color, cell fill, and borders) to a cell, provided that certain conditions are fulfilled. For example, you can highlight cells in ‘red color’ with sales below target by using conditional formatting in Excel: “Highlight Cells Rules > Less Than > target value > format low performers (red fill).”
- Data Bars: Excel lessons for beginners are incomplete without learning about data bars. These are essentially colored bars within a cell to compare the value of each variable with the other. The graphical representation of colored bars within cells of various lengths makes it eye-catching and saves time in decoding comparable data.
- Icon Sets: These assign pre-defined icons (arrows, stars, faces, etc.) to cells based on set conditions. For example, you could use upward arrows for cells exceeding a target value or frowning faces for cells below a certain threshold.
- Table Formatting: This feature is apt for converting a range of cells into an Excel table while improving its overall appearance. Tables come with formatting options and features like sorting, filtering, and structured references, making data management more efficient.
- Charts and Graphs: Just like a PowerPoint presentation would include various charts (pie & line charts) and graphs (bar & area graphs), an Excel spreadsheet also has this feature. All you have to do is highlight the data you want to represent in chart form and navigate to the “insert tab” which contains icons for various chart types. Select any trendy chart that suits your work style and watch lengthy numeric values transform into diagrams.
- Page Layout and Print Options: Formatting in Excel isn’t limited to on-screen data presentation. The Page Layout and Print Options features allow you to control how your spreadsheet looks when printed. Adjust settings like margins, orientation, and print area to ensure your data is presented professionally on paper.
The TechnoSales Lesson Plan:
The TechnoSales project by TechnoKids is designed to teach students the practical application of mathematics and technology through the planning and execution of a bake sale. These Excel lessons for beginners are integral to this project because they provide the skills necessary for students to organize, analyze, and present data effectively. This EdTech platform is available for integration in schools across Dubai and other regions of the world.
Here’s why Organizing data is crucial for the TechnoSales project’s success:
- Informed Decision Making: By organizing data in spreadsheets, students can analyze survey results, sales trends, and calculations effectively. This empowers them to make informed decisions about the bake sale, selecting popular dessert options, setting realistic goals, and determining the number of items required.
- Identifying Trends and Patterns: Through proper data organization, students can uncover valuable insights. For instance, comparing dessert preferences between boys and girls through a double-column graph might reveal a clear favorite.
- Accuracy and Efficiency: Excel lessons for beginners help minimize errors and streamline calculations. For example, well-formatted spreadsheets allow students to use formulas to calculate the total number of desserts needed based on past sales data, ensuring they bake enough to meet their financial goals.
- Communication and Clarity: It allows students to easily reference data during presentations or discussions, fostering clear communication and collaboration throughout the project.
- Building Foundational Skills: Data organization is a transferable skill applicable to various subjects and future endeavors. The TechnoSales project instills these skills in students at a young age, preparing them to handle information effectively in diverse settings.
Mastering the formatting features of Excel is essential for beginners, as it enhances data presentation and analysis. Through projects like TechnoSales, students not only learn these skills but also apply them in real-world scenarios, making data organization fun and practical.


Recent Comments