
How is Data Analysis in STEM Education Useful
Data analysis in STEM education involves a systematic process that allows students to explore, interpret, and draw meaningful conclusions from collected data. The steps of the data analysis process can be adapted for different grade levels, ensuring that students develop foundational skills in science, technology, engineering, and mathematics. Here are the main steps in the data analysis process:
- Asking Questions: Encouraging students to ask questions is the foundational step in the data analysis process in STEM education. These questions should be thoughtfully crafted, clear, and aligned with the objectives of the investigation. Open-ended inquiries stimulate critical thinking and curiosity, fostering a sense of curiosity that propels the entire analysis.
- Collecting Data: The second step involves developing a well-defined plan for collecting data. This plan should outline the type of data to be gathered and the methods to obtain it. Whether through observations, measurements, surveys, or experiments, students learn the importance of precision and consistency during data collection, laying the groundwork for accurate analysis. (For example, Sarah’s science class built a ramp for a toy car. They pushed the car with different strengths and saw how far it rolled. By collecting this data, the class could see how the strength of the push (force) impacted how far the car moved).
- Organizing and Cleaning Data: After the collection phase, students dive into the critical process of organizing and cleaning data, a cornerstone in the realm of data analysis in STEM education. This phase involves structuring the data in an organized format, such as tables or spreadsheets, and meticulously reviewing for errors or inconsistencies. By emphasizing the significance of clean data, students ensure the reliability of their findings during subsequent analysis.
- Analyzing Data: The heart of data analysis in STEM education lies in utilizing mathematical and statistical tools to derive insights from the collected data. Students learn to calculate averages, read graphical representations, and apply relevant formulas. This step lets them discern patterns, trends, and relationships, fostering a deeper understanding of the subject matter. (For example, Sarah creates a table with columns for “Force applied” and “Distance traveled.” Plot the force on the x-axis and distance on the y-axis. Each data point represents one trial, which can predict specific patterns or trends).
- Drawing Conclusions: Drawing meaningful conclusions synthesizes data analysis. Students are prompted to reflect on their findings and articulate how they relate to the initial questions or hypotheses. This step bridges raw data and scientific or engineering principles, facilitating a comprehensive understanding of the investigated phenomenon within the context of data analysis in STEM education.
- Communicating Results: Effectively communicating results is crucial in STEM education. Students are guided in presenting their findings through written reports, presentations, or multimedia formats. Emphasis is placed on clarity and conciseness, ensuring that their communication effectively conveys the outcomes of their data analysis to a broader audience.
- Representing Data: Visualization is a crucial aspect of the data analysis, offering a visual representation to enhance understanding. Once data is collected and organized, students delve into graphing and charting, translating raw numbers into insightful visuals like bar graphs, line graphs, and pie charts. This step deepens comprehension and hones their ability to convey complex concepts visually. Mastering this skill enables effective communication of findings and aligns with STEM education’s goals, integrating technology and graphical representation to efficiently convey scientific and mathematical principles. (For example, Sarah can prepare pictorial slides that will showcase the findings with images, data tables, and distance vs. force graphs so that the inference is clear that stronger pushes make the car travel farther).
- Reflecting on the Process: In the culmination of data analysis in STEM education journey, the final stage invites students to reflect on the entire learning. Students are encouraged to consider the challenges encountered, the decisions made, and the lessons learned. This reflective practice solidifies their understanding of scientific or engineering concepts and instills a mindset of continuous improvement and learning from each analytical endeavor.
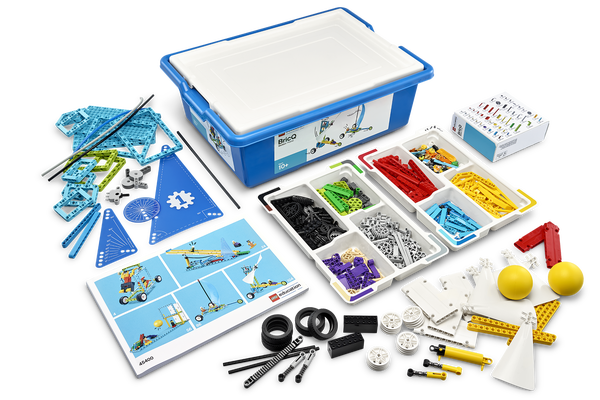
LEGO® Education BricQ Motion ignites young minds by letting them explore the fascinating world of forces and motion through the power of LEGO® bricks. This hands-on solution, perfect for elementary and middle school students, allows them to experiment without needing technology. Students can build engaging models, conduct investigations, and discover how forces impact movement, fostering a deep understanding of these core scientific concepts. Notably, the set is readily available in the Middle East, including Dubai, bringing the excitement of BricQ Motion to students in the region.