Effectiveness of Infographics and Teaching Students How to Design an Infographics
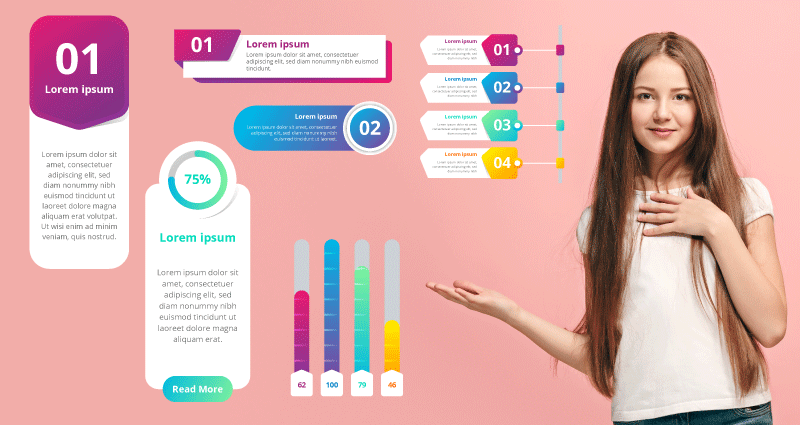
An Infographics is nothing but a visual representation of data. They say an image speaks a thousand words! Well, infographics apply the same thumb rule. When the information is represented on charts, pie diagrams, and imagery, with minimal content of text, we refer to it as an infographic.
Where are Infographics used?
Infographics are use to convey a message to the audience without confusing them with unnecessary jargons. In today’s age, your audience doesn’t have time to read lengthy paragraphs and comprehend the meaning of the texts. Everyone appreciated crisp information and to-the-point data, which is where infographics comes handy.
One might have come across different pictorial representation of messages on social media platforms such as LinkedIn or Twitter. Many brands use infographics to drive important analytical data to the audiences, by using marketing creatives that showcase pie charts, bullet points, and thumbnails in their advertisement.
While making a corporate presentation often company statistics are presented in the form of an infographics to grab the attention of the co-workers and drive the point home. Emailers, newsletters, hoardings, you would be surprised to bump into an infographic design every now and then.
Even in schools’ infographics makes studies easier to grasp. For example: To distinguish between farm animals and wild animals, healthy and un-healthy foods, often an interesting colorful chart is represented with explainer points under each classification. Another example is; History lessons can be made easy by having an infographic representing events and dates on a timeline chart, so that it is easier to recollect the facts during exams.

Why are Infographics effective?
Infographics are very effective for reasons more than one. Let us see how:
- Visual representation of data reveals a story. The different scenes of a story are interwoven and presented in one infographic image. This makes it more intriguing for viewer and they can easily visualize the message.
- Interesting background colors, templates, icons, different font styles, and unique graphs make it eye-catching, rather than having to read through lengthy texts.
- Important facts are highlighted in an infographic. Since the design can accommodate only limited text, and it has a defined dimension, unnecessary points are done away with completely.
- Step by step methodologies are clearly represented to the audience. For example: ‘steps to install an App’ on your mobile and how to go about using it, can be highlighted on an infographic.
How Students Benefit from learning to Design an Infographic
For designing an infographic, one needs to have knowledge about basic computer skills and be familiar with the functioning of the design software. Here are a few benefits gained by students on getting started with curating infographics:
Applying Research Skills
To be able to factually represent data, the student must have good understanding about the topic. Information can be availed on the ‘web’ or one can read a ‘book’ on the topic from the school’s library. This primary research helps the child to understand why in-depth reading is important and how facts can be presented graphically. Subjects such as science, math, and geography can extensively make use of infographic mediums.
Using Computer Literacy
In order to design the infographics and make it visually appealing, the child should understand graphic designing elements and apply them correctly. There are numerous platforms that children can use for designing purposes like; canvas, paint, Adobe InDesign, however these are at advanced stages. To start with, schools in the UAE, including Dubai recommend the TechnoKids tool, which designs age-appropriate learning modules on computer lessons for students. TechnoEarth is one such project where students are instructed to build infographics related to an Environmental issue in a guided step-by-step manner. Children learn how to add charts, add colors, use outlines, insert text, add titles, and calculate percentages, wherever necessary on the infographic. If you reside in the Middle East or belong to the GCC Countries, you can learn more about the TechnoKids platform by visiting our website: https://knowledge-hub.com/technokids/.
Enhances Creative Thought Process
Children are allowed to let their imagination run wild. How fun it is to choose colors, create layouts, draw lines, and decide upon a theme for the infographic designs. One also needs to inset the right images, add titles, and highlights stats on the image. Students love to experiment, and this is one of their greatest opportunities to apply their creativity and design something totally out-of-the-box.


Recent Comments